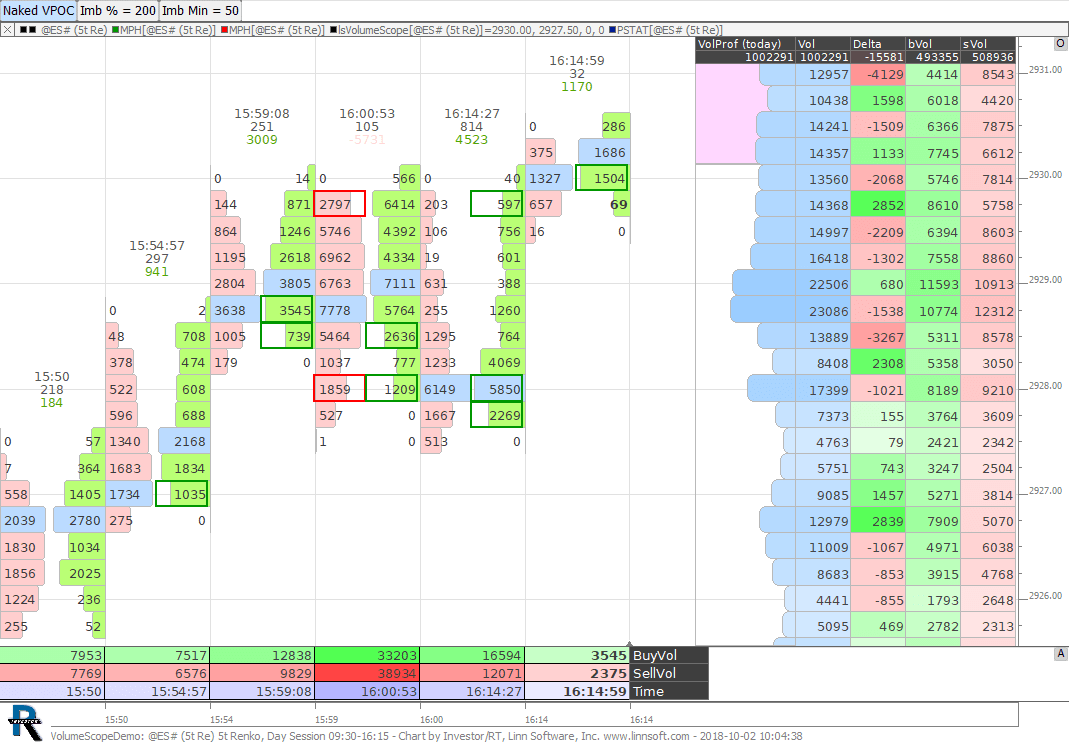
View Buy, Sell, Total Volume or Time at Price — with Day/Overnight sessions split. Draw custom profiles over any period, create long-term composites (5–10+ years), use POC/VAH/VAL in studies, extend Naked levels to today, and customize display with Heat Map, Holograms, Lines or Blocks.
Track Bid vs Ask Volume (Volume Delta) — historically and in real time. Filter by trade size to spot large traders, view accumulated Delta in candlestick format for divergences, apply indicators like Moving Averages or Session Stats, monitor Average Buy/Sell Size, Bid/Ask Size, Tick Frequency, build custom RTL studies, and more.
The original intraday profiling method by J. Peter Steidlmayer, licensed by the CME and released to the public in 1985. Assigns market value using normal Gaussian distribution for any time period. Split Day vs Overnight Sessions, divide profiles at any letter for deeper analysis, automatically add RTL study reference lines, and extend Naked POCs, VAHs, or VALs to the current day to highlight unfilled levels.
Powerful tool to compare any market statistic (down to the minute) with its historical performance. See today’s Volume or Range at the exact minute versus the average for that same minute on prior days. Add reference lines for Overnight/Initial Balance Highs & Lows, ranges, or any key value. Integrate into custom RTL studies to analyze past behavior of other indicators, and compare today’s market to last week, month, or year.
Simple scripting language for creating custom indicators, signals, and scans in Investor/RT — no programming experience required (though it helps). Uses straightforward tokens like OPEN, HIGH, CLOSE, MA, RAWK, FASTD, CCI to reference market data and indicator values. Supports basic arithmetic (+, -, *, /), comparisons (<, >, >=, <=), and a full library of built-in functions such as Minimum, Maximum, Average, Sum, and more.
Choose from a wide range of chart types: time-based (Second, Minute, Daily, Weekly, Monthly), tick-based (new bar after set number of trades), volume-based (new bar after set volume), range-based (new bar after set high/low range), change-based (new bar after set open/close range), plus Point & Figure and Renko.
Monthly Costs
Investor/RT Monthly billing: $50
Additions
$25.00 VolumeScope®
$20.00 Volume Analysis Package
$10.00 Trading Systems Package
$20.00 TPO Profile Package
$10.00 Market Depth Package
Per side: Commission + NFA and Exchange Fees
(Commission is based on trading volume, contact us for competitive rates)