Easy to use platform; simple and intuitive solutions allow its use with extreme immediacy.
Settings are saved on the Cloud. Easy to restore and switch between different devices.
Supports 4K Ultra HD monitors. Ultra HD takes the graphical experience of trading to a higher level.
Continuous development of the platform with new features and frequent scheduled releases.
Practice trading without risking real capital with the built-in Overcharts simulator. Test strategies, improve execution, and build confidence in a fully simulated environment.
Market Replay lets traders replay historical market data as if it were live. It is a powerful tool for reviewing price action, studying order flow, and testing futures trading strategies in a controlled environment. For active traders, it can help improve market analysis, trade execution, and overall trading confidence.
Trade Copier allows traders to copy trades from one master account to multiple follower accounts automatically. It helps streamline multi-account trading, improve execution consistency, and save time across linked accounts. For active futures traders, it is a practical tool for trade allocation, account management, and efficient order execution.
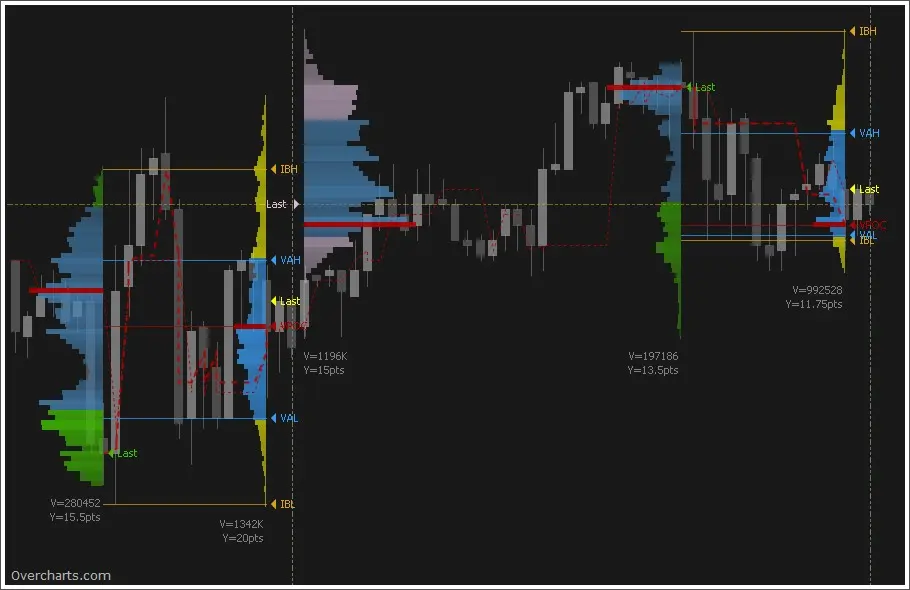
Volume Profile shows how much trading volume occurred at each price level, helping traders see where the market has done the most business. It highlights high-volume nodes, key support and resistance levels, and areas where price may consolidate or react. For futures traders, it is a powerful tool for reading market structure, planning entries and exits, and improving volume analysis.
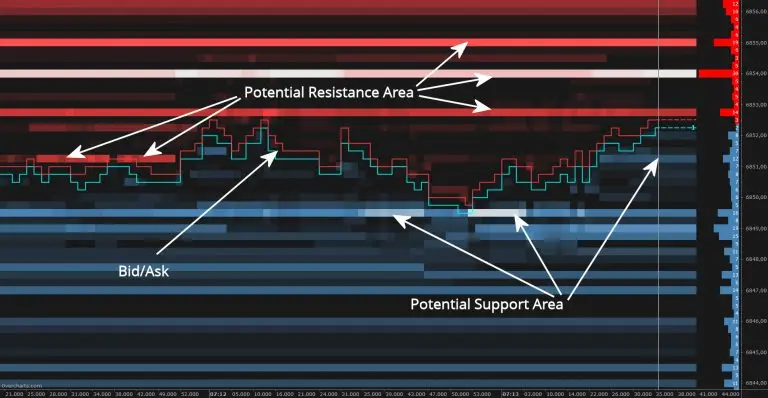
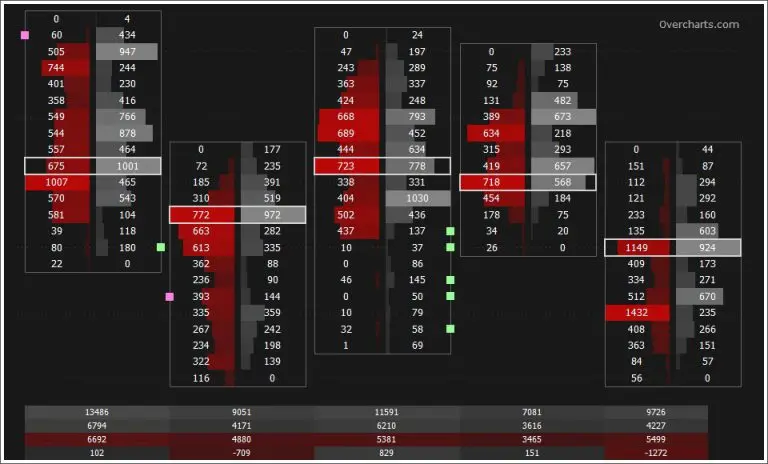
Visualize market depth with a real-time DOM heatmap built for active futures traders. Color-coded price levels help identify support and resistance, liquidity zones, and high-volume areas. It is a valuable tool for order flow trading and volume analysis.
The Volume Ladder, also known as a footprint chart, helps traders analyze order flow inside each bar. It displays bid and ask volume, delta, and other key volume statistics in one clear view. This gives futures traders deeper insight into market pressure, absorption, and momentum.
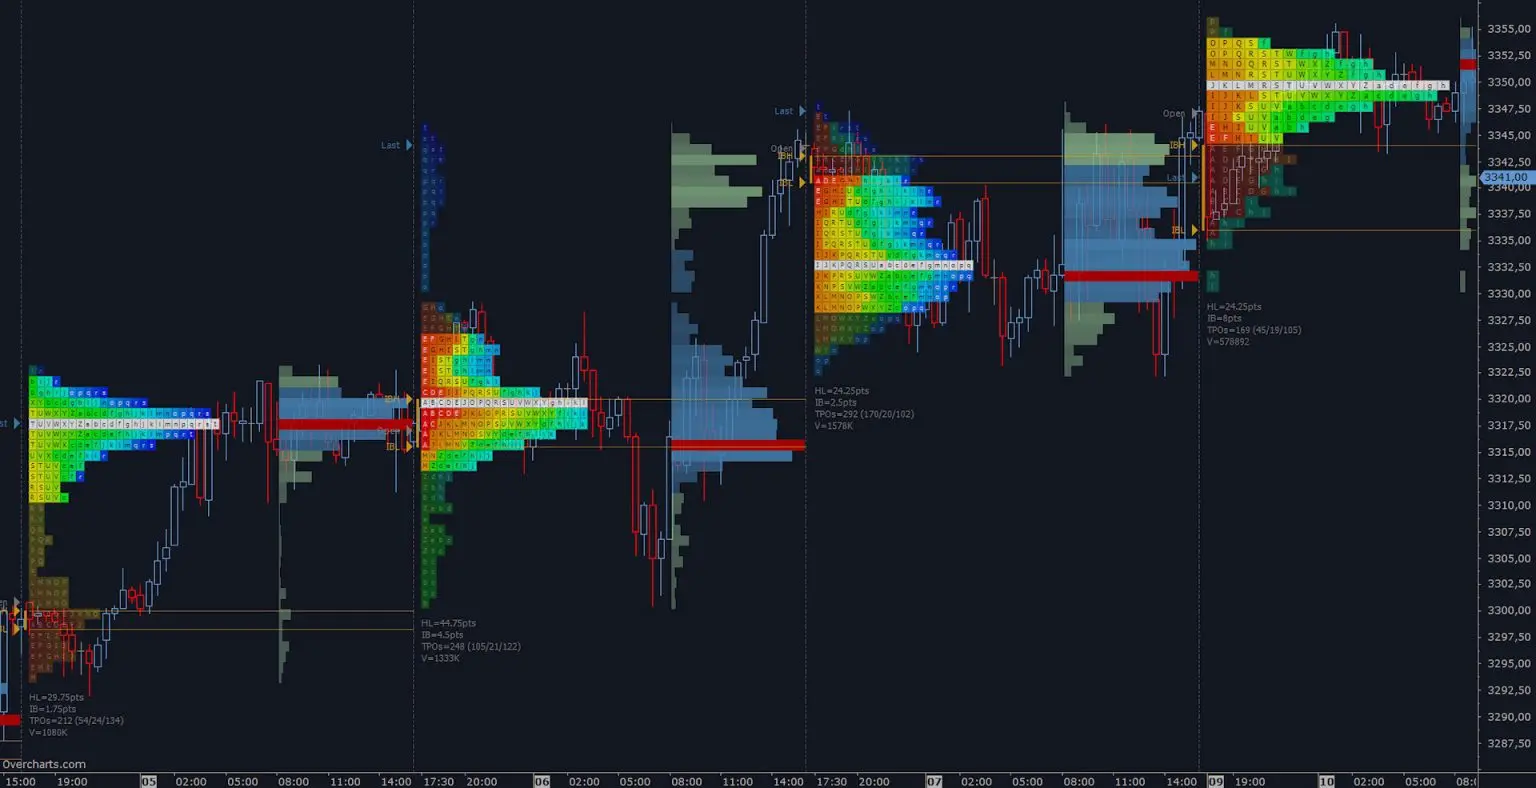
TPO Profile, also known as Market Profile, shows how price was distributed over time and where the market spent the most time trading. It helps traders identify key price levels, balance areas, and potential support and resistance zones. When used alongside Volume Profile, it can provide deeper insight into market structure and auction behavior.
FREE 30-DAY TRIAL
ALL Features Included
All Data-Feeds Enabled during Trial Period
NO TIME LIMIT for End-of-day/DDE data-feeds (e.g. Yahoo, Metastock, DDE)
$29.95 per month* BILLED ANNUALLY IN ADVANCE 25% OFF
ALL Features Included
Live Trading
Real-Time quotes connected with your broker data-feed subscriptions**
All Data-Feeds Enabled
Unlimited Free Upgrades
Support by email & ticket
ALL-INCLUSIVE plan features enabled with 2 data-feeds of your choice
With this plan you can connect to the chosen data-feeds ONLY (even with multiple accounts)
Overcharts is a futures trading platform built for traders who want advanced charting, order flow tools, and volume analysis in one workspace. It is commonly used for footprint charts, Volume Profile, TPO Profile, Market Replay, and DOM-based analysis. Traders use it to study market structure, liquidity, and price behavior with more precision.
Yes. Overcharts is designed for order flow trading and volume analysis, with tools such as Volume Ladder, Market Depth Map, Volume Profile, and TPO Profile. These features help traders analyze bid and ask activity, liquidity, support and resistance, and market participation in greater detail.
Yes. Overcharts includes footprint chart functionality through its Volume Ladder tool. It displays bid and ask volume, delta, and other order flow statistics directly inside each bar, helping traders read buying and selling pressure more clearly. Overcharts notes that Volume Ladder uses 1-tick data to be built properly.
Yes. Overcharts includes Volume Profile, which shows how traded volume is distributed across price levels. Traders use it to identify high-volume nodes, value areas, and possible support and resistance zones as part of market structure and volume analysis.
Yes. Overcharts includes TPO Profile, also known as Market Profile. It shows where price spent the most time during a session, which can help traders identify balance areas, key price levels, and potential support and resistance.
Yes. Overcharts includes Market Replay, which allows traders to replay historical market data in a live-like environment. It is useful for reviewing price action, testing strategies, and practicing with historical 1-tick data for replay and many volume-based indicators.
Yes. Overcharts includes Market Replay, which allows traders to replay historical market data in a live-like environment. It is useful for reviewing price action, testing strategies, and practicing with historical 1-tick data for replay and many volume-based indicators.
Yes. Overcharts includes a trading simulator that lets traders practice in a simulated environment without sending live orders. This can help traders test strategies, improve execution, and learn the platform before trading live. Overcharts lists Trading Simulator as one of its core platform features.
Yes. Overcharts includes tools such as Volume Profile, TPO Profile, Market Depth Map, and Volume Ladder that can help traders identify possible support and resistance areas based on volume, time at price, and order book activity. Overcharts’ own help content describes these tools as part of volume analysis used to highlight possible support, resistance, and pivot areas.
Yes. Overcharts includes a Trade Copier feature that allows trades from one account to be replicated across multiple follower accounts. This can help traders manage multi-account trading setups more efficiently. Trade Copier is listed among Overcharts’ primary platform features.